Date [YYYYMDD] day of year
Time [UTC] :
Sun (only optical refractive elevation corr.)
Ra Dec
Az El
Ang.diameter [deg]
Moon (only optical refractive elevation corr.)
Ra Dec
Az El
Days after full moon
Phase [0 = Full Moon]
angle to Sun [clockwise from top]
moon to sun, pole to zenith [deg]
Distance (geoc./topoc.) [km]
Ang.diameter (geoc./topoc.) [deg]
Frequency [GHz]
Wavelength
Moon reflectivity ε
Moon temp. center, average
Rx antenna temp. of moon

Latitude [N°]
Longitude [E°]
Dish diameter [m], ant.gaintheo
Dish f/D
Offset angle if offset dish [°]
Surface RMS [mm], peak err
Feed out-of-axial-focus [mm]
Feed blocking area [m2]
Edge taper [dB], feed taper
Dish center - rim
Ohmic efficiency ηohm
Illumination efficiency ηi
X-polarization efficiency ηpol
Spillover efficiency ηs
Phase efficiency ηphase
Illum*phase*spill*xpol ηi*p*s*x
Surface efficiency ηRuze
Focus efficiency ηfocus
Blocking efficiency ηblock
Mesh grid diam, spacing [mm]
Mesh grid effi. ηmesh, loss
HPBW
Position x,y on Moon [°]
Intercepted power fraction
Illuminated fraction
TX temperature [°C]
TX humidity [%]
TX absolute pressure [mbar]
TX zenith atmosph.attenuation
Use time locked TX/RX azimuth/elevation for:
TX azimuth [°]
TX mw refrac.corr.elevation [°]
TX LOS atmosph.attenuation
additional cloud loss [dB]
Latitude [N°]
Longitude [E°]
Dish diameter [m], ant.gaintheo
Dish f/D
Offset angle if offset dish [°]
Surface RMS [mm], peak err
Feed out-of-axial-focus [mm]
Feed blocking area [m2]
Edge taper [dB], feed taper
Dish center - rim
Ohmic efficiency ηohm
Illumination efficiency ηi
X-polarization efficiency ηpol
Spillover efficiency ηs
Phase efficiency ηphase
Illum*phase*spill*xpol ηi*p*s*x
Surface efficiency ηRuze
Focus efficiency ηfocus
Blocking efficiency ηblock
Mesh grid diam, spacing [mm]
Mesh grid effi. ηmesh, loss
HPBW, convolution Tx/Rx
Position x,y on Moon [°]
Received fraction (BWF)
RX fill factor moon
RX temperature [°C]
RX humidity [%]
RX absolute pressure [mbar]
RX zenith atmosph.attenuation
RX azimuth [°]
RX mw refrac.corr.elevation [°]
RX LOS atmosph.attenuation
additional cloud loss [dB]
UTC YY/MM/DD hh:mm:ss
Isotropic path loss (radar equation)
Path loss (corrected for beam widths)
ε * gainTX * gainRX
TX power [W]
Received signal power
RX NoiseFigure [dB], temp
RX bandwidth [kHz]
RX noise power
Signal/Noise
Received Moon noise
Sky+CMB, zenith+CMB temp
Spillover temp., add. spillover
RX antenna noise temp.
RX main beam effic. ηMB, ηF
Spatial polarization, pol.loss
use +/-90° feed rotation
Y-dish&feed: Absorber/SkyZenith
Y-dish&feed: Gnd/SkyZenith
Y-dish&feed: Absorber/Sky@Elevation
Y-dish&feed: Gnd/Sky@Elevation
Y-feed: Gnd(or absorber)/SkyZenith
SFU@frequency, Sun temp.
Y-Sun: 1+Sun/(Sky+Noise)
Y-Moon: 1+Moon/(Sky+Noise)
G/TEME incl. RX noise temp
S/N EME: Signal/(0+Sky+Noise):
RX libration rate [°/min]
RX libration spreading
Mutual libr. spread, beam corr.
Doppler due to libration
CW integr. time [s], x-sigma
decoder threshold
Margin = S/N EME - threshold
Features:
- For prime focus and offset dish
- Drop down menu for locators-calls with stored system data
- HPBW depend on edge taper/beam shape factor (illumination and spillover efficiency)
- Sun temp curve fit (based on A.O.Benz)
- Calculation of moon noise, sun noise and different ground(absorber)/sky constellations
- Moon temp formula depending on moon cycle and most reliable scientific values from the 60s to now. Due to lack of good data a model for the thermal behaviour of lunar soil including rim correction is used to get most accurate data up to 300 GHz.
- Changing moon reflectivity over surface (curve fit by Joachim Köppen)
- Change moon reflectivity to play with diffrent values. At HPBW <0.1° the reflectivity isn't constant over moon surface (maria/highlands/craters).
Lunar Regions: Permittivity and Reflectivity (25–100 GHz)
Mean lunar reflectivity at 10 GHz — Near side, Far side, and Global - Tx, Rx beam pointing accuracy on moon and resulting loss
- Beam width factor (BWF) and resulting signal loss for 2-way EME
- Fill factor for moon/(sun) S/N measurement
- S/N formulas for prime focus and offset dishes
- If polarization rotation is not compensated you have to add polarization loss to S/N. Values are shown if "use time locked TX/TX elevation for:" for moon is used
- Calculation of dish center - rim distance (half-angle dish opening) and necessary feed taper for given dish edge taper
- Calculation of atmosph. attenuation ITU-R P.676-13 (08/2022), Appendix 1 & 2 until 350 GHz
- Calculation of G/T including system noise temperature
- Calculation of mesh grid loss (based on T.Y.Otoshi)
- Max. achievable dish efficiencies based on gaussian beam and all other losses
- Use illumination, spillover, phase and x-polarization efficiency from simulated or measured feed pattern instead of gaussian beam
- Correct frequency spreading due to moon libration, Rx,Tx HPBW width and sun/moon diameter
- Decoder threshold for SSB, CW, Q65
- Time integration and showing of sigma value for CW signals
- Azimuth, elevation, distance ... of sun, moon for given location (either Rx or Tx) and date/time
- Angular distance between moon and sun, red marked if smaller than 10°
- Calculator from QTH locator into latitude, longitude
- Spillover temp based on f/D, offset angle and elevation
- Because of stronger water vapor changes in atmosphere radio waves are bended stronger than VIS waves (higher refraction). Astronomical formula uses VIS refractive correction.
I use refractive correction for radio waves (based on A.L.Berman)to get most accurate elevation data (error max. 0.01°). - Tx/Rx elevations can be coupled/locked to sun or moon elevation to analyze manually, standard is free elevation input
- Live modus (auto play) to see & follow S/N in real time
- Search for maximum margin of S/N EME in the future. More under hints.
- Map for "illumination of the Moon by Tx beam" or "relative intensity of the reflected power" or "relative intensity of the received moon signal by Rx beam", Tx (blue circle) and Rx (red circle) beam width
- Map for "moon brightness temperature seen by eyes" or "moon brightness temperature smoothed by Rx beam", moon phase overlay
- Map shows direction to sun (white line)
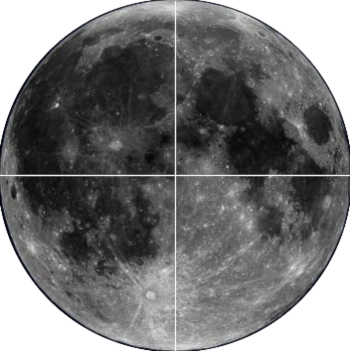
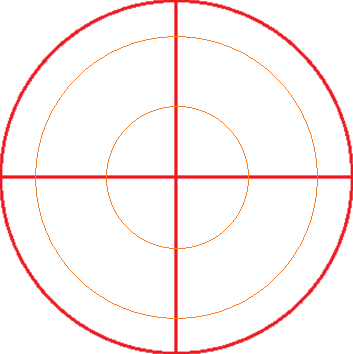
- Moon map for moon surface appearance (Rx and Tx view) with 0.1°/0.2° radius markers (orange circles). Due to moon libration and position angle the visible moon surface looks always different.
The red circle marks the visible moon surface until the angular diameter of 0.5° and the red cross marks the current moon center.
The white cross marks moon latitude = 0 (equator) and moon longitude = 0. Dark areas show marie and bright area show highlands in visual spectrum.
The yellow circle shows the location of max. moon noise and the convolution of Tx/Rx antenna beam (HPBW) if "moon brightness temperature smoothed by Rx beam" is selected - Button for echo mode (Rx=Tx)
- Button for swap mode (Rx<=>Tx)
- Add cloud loss
- Some (mainly unknown) parameters are not locked. You can play with these parameters
General background:
The link budget of an EME communication is described by the radar range equation
PRX = PTX GTX GRX
λ² A ε / (64 π³ d²TX d²RX)
with the transmitter power PTX, the gains
GTX, GRX of transmitting and receiving antennas, the wavelength λ, the area A = π R²moon
of the target (the lunar disc), the reflectivity ε ≈ 0.07 of the lunar soil, and the distances
dTX, dRX between Moon and antennas.
In this equation, the target is taken to subtend a small angle compared to the HPBWs of both antennas. Not taken into account are the elevation-dependent attenuation on the path
through the Earth atmosphere at either end and any variation of the lunar reflectivity across the face of the Moon.
The (imaginary) isotropic antennas will fully and evenly illuminate the lunar disc as well as receive the reflected signal from the entire disc.
This is expressed in the overall EME isotropic path loss
Lpath = πR²Moon (λ²/(4π))
/ (4π d²TX) / (4π d²RX)
= (RMoon λ / (8π dTX dRX) )²
The gains of real antennas compensate this loss. But at higher frequencies and/or with large antennas the radiation patterns may become comparable or even more narrow than the
Moon. Then it is necessary to take into account:
- if the transmitting antenna's HPBW is smaller than the Moon's angular diameter, the lunar disc is only partially illuminated, as the power in the beam of the transmitting antenna will be concentrated in a 'bright' spot on the lunar disc. Only this spot will contribute to the reflected signal.
- if the receiving antenna's HPBW is smaller the angular size of the illuminated spot, it can receive only some part of the power reflected by the Moon.
- if the receiving antenna's HPBW is smaller than the Moon, it picks up only some part of the Moon's thermal noise.
The correction factor to the radar range equation which deals with how well the antenna beams cover the Moon as well as each other is computed from the radiation
patterns, and thus may appropriately be called the Beam Width Factor:
BWF = ∫ ΦTX(x,y) ΦRX(r) dx dy / (π R²moon)
For a better understanding it is useful to split up the BWF into two factors:
BWF = illuminated(HPBWTX) * beam_overlap(HPBWTX, HPBWRX)
The illuminated fraction:
illuminated = ∫ ΦTX(x,y) dx dy / (π R²moon)
measures how much of the lunar disc is illuminated by the transmitting antenna. Note that the illumination factor is quite different from the Moon's filling factor
in the transmitting beam, which is the fraction of beam power received by the Moon.
The beam overlap factor
beam_overlap = ∫ ΦTX(x,y) ΦRX(x,y) dx dy / ∫ ΦTX(x,y) dx dy
indicates the degree by which the transmitting and receiving beam patterns overlap on the lunar disc.
As before, all integrals are taken over the lunar disc. It is worth noting that if both beams have the same width and smaller than the lunar disc, the overlap
factor is 0.5 for any width. Hence, having the same narrow beam in both antennas alone is responsible for a 3 dB loss in the signal level.
The Reflectivity of the Moon can be taken to be constant across the lunar disc (default) or to vary with distance from the disc centre as estimated for
this frequency from measurements (derived from Fig.10 in Evans(1969), and other works).
The image of the Moon can be displayed with:
- illumination of the Moon by the transmitting antenna
- relative intensity of the reflected power
- relative intensity of the received signal
Hints:
- The intercepted power fraction is the part of the power which is captured by the Moon.
- The illuminated fraction is the part of the lunar disc which is illuminated by the transmitting antenna.
- The received fraction (BWF) or Beam Width Factor is the ratio of the power from the illuminated spot received by the receiving antenna's beam and the illuminated fraction of the Moon. This factor is smaller than 1, and describes the additional loss due to the use of beams narrower than the Moon, in comparison with the received power estimated from the radar range equation.
- The isotrop. path loss (radar equation) is the path loss computed with the radar range equation and isotropic antennas, and is what one would expect for a fully and evenly illuminated Moon, observed by a large beam receiving antenna.
- The path loss, corrected for beam widths also includes the losses due to the smaller antenna beams.
- The entire sky contributes to noise from the thermal emission by the Earth atmosphere, and from the Cosmic Microwave Background radiation.
- For the radiation pattern of each antenna one may select among these shapes:
- evenly illuminated circular dish
- Gaussian, max ant. η = theor. -2.5% (default)
- data from feed/dish simulation
- Rather than performing tedious calculations with the detailed radiation pattern, it is
convenient to distinguish three parts in it:
The Main beam or lobe is directed to the target. Its fraction in the whole pattern is described by the (main) beam efficiency ηB. A lower value of η implies that the antenna picks up more ground noise via side and back lobes, which results in a lower S/N ratio. If the reflector's surface is not smoother than about a tenth of the wavelength, these uneven structures cause scattering from the main beam into all other directions, and a corresponding loss (Ruze's equation).
Side lobes are lobes next to the main beam. Here the antenna is less sensitive, but it may well pick up a strong source, like the Sun, which then would render the measurements useless. Further away from the main lobe, there can be angles where the antenna feed looks beyond the rim of the dish and picks up noise from the ground or buildings behind the dish ("spill-over").
Back lobes are the angles opposite the main beam. Here the antenna receives noise from the ground, when it points to the sky. - Light green fields are inputs required from the user. Hit the Enter key to display the new results.
- When a parameter is outside the range of validity for the approximations used in this tool, its fields is marked yellow.
- Enter date, time, frequency and weather conditions.
- Select stored "locator-call-band" Tx and Rx systems from drop down menu or set your desired locator and Tx/Rx system.
- "max. antenna efficiency is calculated/shown. Enter your "used antenna efficiency" that matches reality as best as possible.
- Select "use (real) time locked TX/RX elevation for:" for moon or sun if you want to use calculated moon or sun elevation automatically. Then, for the moon it is possible to track S/N in real time.
- Field "SFU@frequency" should be 0. The tool automatically uses published standard sun temperatures for all frequency ranges. Sometimes it is necessary to adjust
"SFU@frequency" in case of sun activity at frequencies < 20 GHz. Then you can use the field "SFU@frequency". Enter the SFU at the used frequency (it is NOT SFU at 10cm).
Original measured data by NOAA of last 7 days can be found here SFU by NOAA
Older data (since 2002) can be fould in Joachim's Sun Radio Flux file or use his viewer .
These standard sun brightness temperatures/flux are used (black body radiation and A.O. Benz), optical solar disk with a diameter of 32', center temperature is lower:
10368 MHz : 12950 K, 292 SFU (depends strongly on sun activity)
24048 MHz : 10475 K, 1270 SFU
47088 MHz : 8840 K, 4110 SFU
76032 MHz : 7840 K, 9500 SFU
122250 MHz: 6960 K, 21800 SFU
241920 MHz: 5860 K, 71800 SFU
- To calculate the dish gain loss due to a mesh grid then enter wire diameter and grid spacing >0 mm.
- Y-Gnd measurement: Make a cold sky noise measurement at zenith (elevation = 90°) with a dish. Don't use only the feed. At higher frequencies the atmospheric loss is too high and sky noise is not constant over elevation. Due to the high HPBW of the feed not only the (lowest) sky noise in zenith is measured. For hot noise measurement use an absorber (e.g. Eccosorb HR-25) at ground temperature in front of the feed. Use only this method because formula in background is optimized for this.
- Because it is not easy to track the moon with very accuracy (~0.01°) for BOTH antennas at higher frequencies/ bigger dishes we suffer from an increased loss. For a good tracking system use "Position x,y on Moon" of -0.035°/-0.035° and +0.035°/+0.035° as worst case. For a standard tracking system use -0.1°/-0.1° and +0.1°/+0.1°.
- Search for next maximum margin of S/N EME in the future after activation of "locked elevation: MOON" and using button "search maxmargin". This depends on S/N EME and decoder threshold based on libration rate. The tool automatically searches for the next time slot with maximum "S/N EME - decoder threshold" and shows the date/time. This function is usful for extreme EME at 47 GHz or with small dishes or low Tx power.
- Time integration for CW is included. A sigma value >3 represents a clear detectable signal.
Assumptions & limitations:
- For frequencies above 1 GHz.
- Type of feed has a big influence on illumination (and spillover) efficiency. The feed has to match dish f/D and edge taper. If you have a sub-optimal feed ηi*ηs is below 81.5%.
Because of this the tool uses theoretical efficiency -5% to be more realistic. Theoretical efficiency is calculated with gaussian beam and edge taper of -10 dB to get max. 81.5%.
Product ηi*ηs defines HPBW of the dish. Additional efficiences doesn't influence HPBW but will further reduce dish gain.
Because there are often misleading wordings, relations and consequences on efficiencies please read more about antenna efficiency theory in my antenna basics and feed pattern, dish illumination - If there is a simulated feed pattern available, resulting ηi, ηs, ηphase and ηxpol should be used to get more reliable end results. Here you will find some design guides for high-performance feeds.
- Dish forward efficiency ηF is also needed. It is quoted that it is feed efficiency (= 1 - ηs - 1% to 2% efficiency loss due to dish rim scatter). As long as simulated/measured ηs has not been entered I use a fixed value of 0.85 which fits most cases.
- Clear sky weather for sun/moon noise measurement without any thick atmospheric inversion layers
- Lunar reflectivity and moon temperature data are from the 60's, 70's and 80s. There aren't newer data available and all these data have great variation.
A summary of these data and a simulation model is available here "moon brightness temperature",
"moon radio images"
For a better understanding of moon temperature over moon phases see here. I use this model to calculate center moon and average moon temperature. The map can visualize the distribution of the moon brigthness temperature for the given frequency. It is also possible to visualize the smoothed brightness temperature by the antenna beam width in the map.
More EME tools from Joachim DF3GJ see here.
More about antenna related topics from Joachim DF3GJ see here.
What's about clouds and rain?
There are a lot of useful papers from ITU-R.
Clouds are not really a big problem. At 10 GHz cloud loss is 0.001 dB/km.
The biggest problem is rain or invisible rain in clouds. Fog is relevant above 47 GHz.
At 47 GHz cloud loss is 0.04 dB/km for less fog.
At 47 GHz cloud loss is 0.085 dB/km for medium fog (vis 300 m).
At 47 GHz cloud loss is 0.85 dB/km for thick fog (vis 50 m).
At 76 GHz cloud loss is 0.09 dB/km for less fog.
At 76 GHz cloud loss is 0.17 dB/km for medium fog (vis 300 m).
At 76 GHz cloud loss is 1.74 dB/km for thick fog (vis 50 m).
Rain loss at 10GHz:
Drizzle: 0.1 mm/h -> 0.0007 dB/km
Light rain: 1 mm/h -> 0.01 dB/km
Medium rain: 10 mm/h -> 0.21 dB/km
Tropical/thunderstorm rain: 100 mm/h -> 3.7 dB/km
Rain loss at 24GHz:
Drizzle: 0.1 mm/h -> 0.014 dB/km
Light rain: 1 mm/h -> 0.14 dB/km
Medium rain: 10 mm/h -> 1.4 dB/km
Tropical/thunderstorm rain: 100 mm/h -> 14.0 dB/km
Rain loss at 47GHz:
Drizzle: 0.1 mm/h -> 0.09 dB/km
Light rain: 1 mm/h -> 0.59 dB/km
Medium rain: 10 mm/h -> 3.9 dB/km
Tropical/thunderstorm rain: 100 mm/h -> 25.7 dB/km
Rain loss at 76GHz:
Drizzle: 0.1 mm/h -> 0.2 dB/km
Light rain: 1 mm/h -> 1.1 dB/km
Medium rain: 10 mm/h -> 5.8 dB/km
Tropical/thunderstorm rain: 100 mm/h -> 30.4 dB/km
Some dish parameters as reference:
DL0SHF 10 GHz:
Diameter: 7.2 m
f/D: 0.35
Surface rms: 0.85 mm
Feed blocking diameter: 0.3 m
HPBW: 0.3°
Aperture efficiency: 60%
Gain: 55.7 dBi
DL0SHF 24 GHz:
Diameter: 3.7 m
f/D: 0.35
Surface rms: 0.35 mm
Feed blocking diameter: 0.3 m
HPBW: 0.26°
Aperture efficiency: 60%
Gain: 57.2 dBi
| Top of the Page | to my HomePage |